Experience Comprehensive Cybersecurity

AI Multilayered Cybersecurity Platform Built for MSPs to Secure & Insure Small to Medium-Sized Businesses Against Cyber Threats.

Dashboard displaying a network security overview with statistics: 108 users, 111 devices, 124 mailboxes, 34 cloud services, 38 internet assets. It shows 6 customers, issues by risk level, a radar chart for security control, and insights on the right.
A purple circular play button with a white triangle in the center, surrounded by a dark purple border.
Screenshot of a dashboard displaying security data. It shows numbers of users, mailboxes, domains, and internet assets. A radar chart visualizes issue coverage, while a bar graph categorizes risk levels. Insights on security concerns are listed on the right.
Screenshot of a security dashboard showing metrics: 108 users, 111 devices, 124 mailboxes, 74 browsers, 62 cloud drives, 38 internet assets. The left side displays a risk coverage chart. Insights on issues by risk are listed on the right.
Dashboard screen displaying analytics: Left panel shows customer, device, and email statistics. Central area highlights a chart on security control coverage. Right panel lists issues by risk levels, with insights on user, security, and operations.
A security dashboard displaying various controls such as Cloud Directory Posture, External Footprint Scan, Dark Web Monitoring, and more. Each control shows status indicators like Active and corresponding assets or domains. Overall activation is 20%.
A dashboard showcasing a user management system highlights details like email address, name, role, cloud apps, MFA, and secure browsing. Colorful icons enhance the interface while emphasizing cybersecurity measures that MSPs can rely on for email protection and DLP.
A dashboard displaying cybersecurity metrics, including a circular chart, numerical indicators for emails and malicious activity, and a highlighted insights section detailing security issues and risks.
A dashboard displaying cybersecurity statistics: 108 users, 111 devices, 124 malicious, 62 chanced, and 38 inserted assets. A highlighted insurance widget shows a risk threshold of 88 and business score of 71. Various security insights are listed.
A dashboard displaying cyber insurance options highlighted on the right, with a Request Quote button. Various security metrics and charts are shown, including user data, issues by risk level, and insights. The interface is predominantly white and gray.
Illustration of a person in a green jacket standing with arms crossed, casting a superhero shadow on a light background.

All Your Customers' Assets in One Place 👨‍💻

Guardz automatically discovers and monitors all your customers’ digital assets. Drill down to see more details and discover related issues.

You're in the Pilot Seat 🚀

Guardz provides the security controls
and coverage across your customers and detects issues in real-time.

Consolidate Your Security Controls 💪

Get all the security controls needed to fortify your client cyber posture.

Gain a Holistic Aggregated View 🤩

Real-time protection of all business employees across all applications, devices, and communication channels.

Take Action based on AI-Driven Security Insights 🦾

Connect the dots across detections and swiftly remediate, regardless of the attack vector.

Strengthen Cyber Posture ⚡️

Real-time cybersecurity posture score that reflects the cyber risk and remediation plan.

Transfer the Risk for Peace of Mind 😌

Get the coverage that you need at the right price based on your clients’ posture.

Discover the Power of Guardz

Trusted & Integrated

Get the Confidence You Deserve

MSP-First by Design

We are dedicated to designing solutions catering to the needs of multi-org and aggregated view environments, providing a comprehensive and dynamic MSP experience.

Security in our DNA

By assessing both internal and external vulnerabilities, from exposed assets to risky users, we proactively protect against the top attack vectors from the inside out.

Simplicity at the Core

Unified interface and quick onboarding process, complemented by integrated and curated security controls, seamlessly detects, prevents, and responds to advanced cyber threats.

Empower Your MSP, Protect Your Clients

Integrated Security Controls in One Backbone

The Guardz Security Controls are a reflection of the holistic approach to cybersecurity, putting the core safeguards in one place while simplifying the setup and management of these critical controls.

This centralized view of Guardz Security Controls enables hassle-free configuration for each control, ultimately simplifying security implementation and issue resolution
in a breeze.

Integrated Security Controls in One Backbone

A dashboard displaying security controls for customers, including sections for Cloud Directory Posture, External Footprint Scan, Dark Web Monitoring, Cloud Data Protection, Email Protection, and Endpoint Security, each with user activity stats.
A security controls dashboard displays various security features: Cloud Directory Posture, External Footprint Scan, Dark Web Monitoring, Cloud Data Protection, Email Protection, and Endpoint Security, each with usage indicators and customer activity status.

Single View of All Issues

A dashboard displaying a list of 23 issues, including: Missing Awareness Training, MFA Missing Admin Google, Suspicious Email, and Non Compliant Antivirus Policy. Each issue has associated security control icons and details.
A screenshot of a security issue tracking interface. It lists 23 issues, such as missing awareness training, non-compliant antivirus policy, and external shares. Categories include awareness, cloud directory posture, and email protection.

Single View of All Issues

Guardz continuously scans for threats across multiple attack vectors and generates issues when a threat is detected. Issues are prioritized by severity of risk and include all the relevant details to trigger automated and manual remediations.

See more specific information about the issue, choose the most suitable remediation, and complete the action to resolve the issue.

Users are the First Line of Defense

Users are at the center of defining an organization’s risk, so Guardz aggregates user-level data to paint a picture of employee risk and its impact on the company.


A company’s cloud directory (Google or Microsoft) is the source of the user list and is enriched with data about licensing, role, cloud apps, issue status, related devices, and more.

Users are the First Line of Defense

A user management interface displaying a list of 17 users with details like email addresses, first and last names, roles, cloud apps used, MFA status, and leak credentials status. Some users have alerts for MFA and credentials.
A dashboard showing a list of 17 users with columns for status, email address, full name, first name, last name, role, cloud apps, MFA, and leaked credentials. Each row contains individual user data, icons, and status indicators.

Secure All Devices

A screenshot of a system interface displaying a table with columns for Hostname, Status, Serial Number, Users, OS, and OS Version. Rows are labeled Risky in red, with varying hostnames and OS icons for Windows and macOS.
A computer dashboard displaying a list of devices, their statuses labeled Risky, and corresponding details like hostname, serial number, users, operating system, and OS version. Icons for Windows and Mac OS are visible.

Secure All Devices

The simplified device management feature offers visibility into devices across an organization, providing vital information on their health status, relevant metrics, threat/risk levels, and existing issues.

This enhances the management of a company’s antivirus capabilities and streamlines the process of addressing device-related concerns.

Full Visibility of Digital Footprint

Attackers exploit weak points in the organization’s network, often left unprotected. The Guardz External Footprint Scan helps you to discover, manage, and monitor your organization’s assets in one place.

Upon initial sign-up, Guardz will run a scan automatically on all assets related to your primary domain (domains, sub-domains, and IPs) and discover all the connected assets.

Full Visibility of All Digital Footprint

A table of internet assets shows details such as asset numbers, types, geo-locations, and issue status. The geo-locations include the United States and Canada, with some entries marked with green check marks and others with red exclamation marks.
A dashboard showing a list of internet assets with columns for asset numbers, types, geo-locations, and issue statuses. Some assets are marked with flags of the USA and Canada, and issues are indicated with green checkmarks and red crosses.

Building Awareness Culture

A digital interface displaying a selection of campaign options. Highlighted is Phishing Simulation, tagged with hashtags like #phishing and #simulation, featuring an icon of an envelope. Other visible options include Compliance 101 and Corporate Scams.
Dashboard interface showing available campaigns. Highlighted is Phishing Simulation with options to create or open. Other campaigns include Compliance 101 with 3 videos, Corporate Scams, and Phishing #1. Total campaigns: 28.

Building
Awareness Culture

Guardz ensures up-to-date employee training by notifying admins of training status and recommending industry-standard best practices. Customizable campaign planning allows businesses to target specific users and meet company goals.

Phishing simulations help employees learn to avoid threats like ransomware and malware, while mandatory evaluations measure the impact of training.

Partner Growth Hub

The Guardz Growth Hub includes crucial tools designed to boost revenue, attract new clients, and demonstrate immediate value. This is achieved by leveraging Prospecting and ROI reports, facilitating easy access to marketing collateral, and providing a visual representation of your subscription, clients & channel managers.

Utilize the Growth Hub to foster vital business conversations and contribute to your company’s growth.

Partner Growth Hub

A person holds a tablet displaying a risk analysis dashboard. The screen shows various graphs, charts, and numerical data, including a risk score of 63 and a financial impact of $147,000. The tablet is held in their hands over a wooden floor.
A person holds a tablet displaying a business analytics dashboard. The screen shows various charts, numbers, and graphs, including a bar chart, pie chart, and financial figures, all on a black background.

Unified Detection & Response

Email Security

Stay ahead of potential email threats by leveraging a user-friendly API-based email security solution.

Cloud Data

Enable cloud data protection to achieve a safe and secure data collaboration with external users

Cyber Awareness

Equip employees to be the first line of defense against the evolving landscape of cyber threats

External Footprint

Gain actionable insights on external threats by scanning digital footprint and exposed vulnerabilities

Endpoint Security

Protect laptops, and desktops from cyber threats such as malware, and ransomware

Secure Browsing

Keep your browser secure with the Guardz extension for protection against viruses and malicious sites

Phishing Simulation

Continually simulating cyber attacks like phishing emails to highlight weak spots

Insurance

Transfer the cyber risk associated with evolving cyber threats with tailored coverage at the right price

Logos of various software and services arranged in a circle. From top: Google, Monday.com, Windows, Google Drive, Dropbox, macOS, and Outlook.

Integrate Your Tools, Enhance Your Protection

Guardz integrations and apps help you work seamlessly, enhance security, and boost efficiency.
A collage of seven circular icons featuring logos of various apps: Gmail, OneDrive, a message bubble with a white dot, an V-shaped envelope, Microsoft, an A with a checkmark, and Google Chrome.

Reviews From Our Partners

Looking for Answers?
You're in the Right Place.

The Guardz platform is built for Managed Service Providers (MSPs) and IT Service Providers that protect small and medium-sized businesses against evolving cyber threats. 

To get started with Guardz, please check out this article from the Guardz Help Center:
MSP Getting Started with Guardz

Small to medium sized businesses are frequent targets of cybercriminals due to their weaker cybersecurity defenses. Common attacks include phishing, ransomware, malware, and insider threats, which can result in financial losses and reputational damage.

Guardz seamlessly provides continuous monitoring of both internal and external vulnerabilities. In the event of a potential threat, you will be immediately alerted and provided with a comprehensive remediation plan.

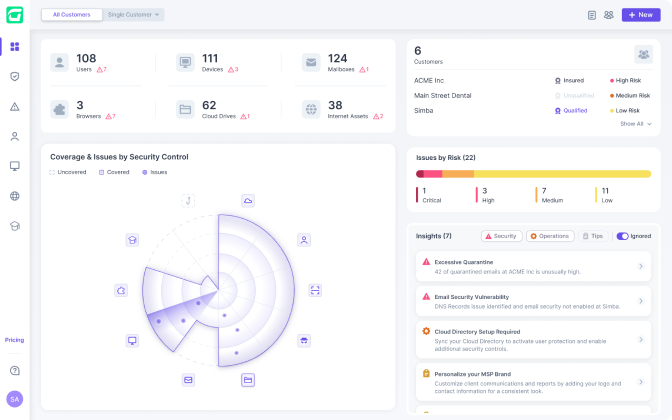
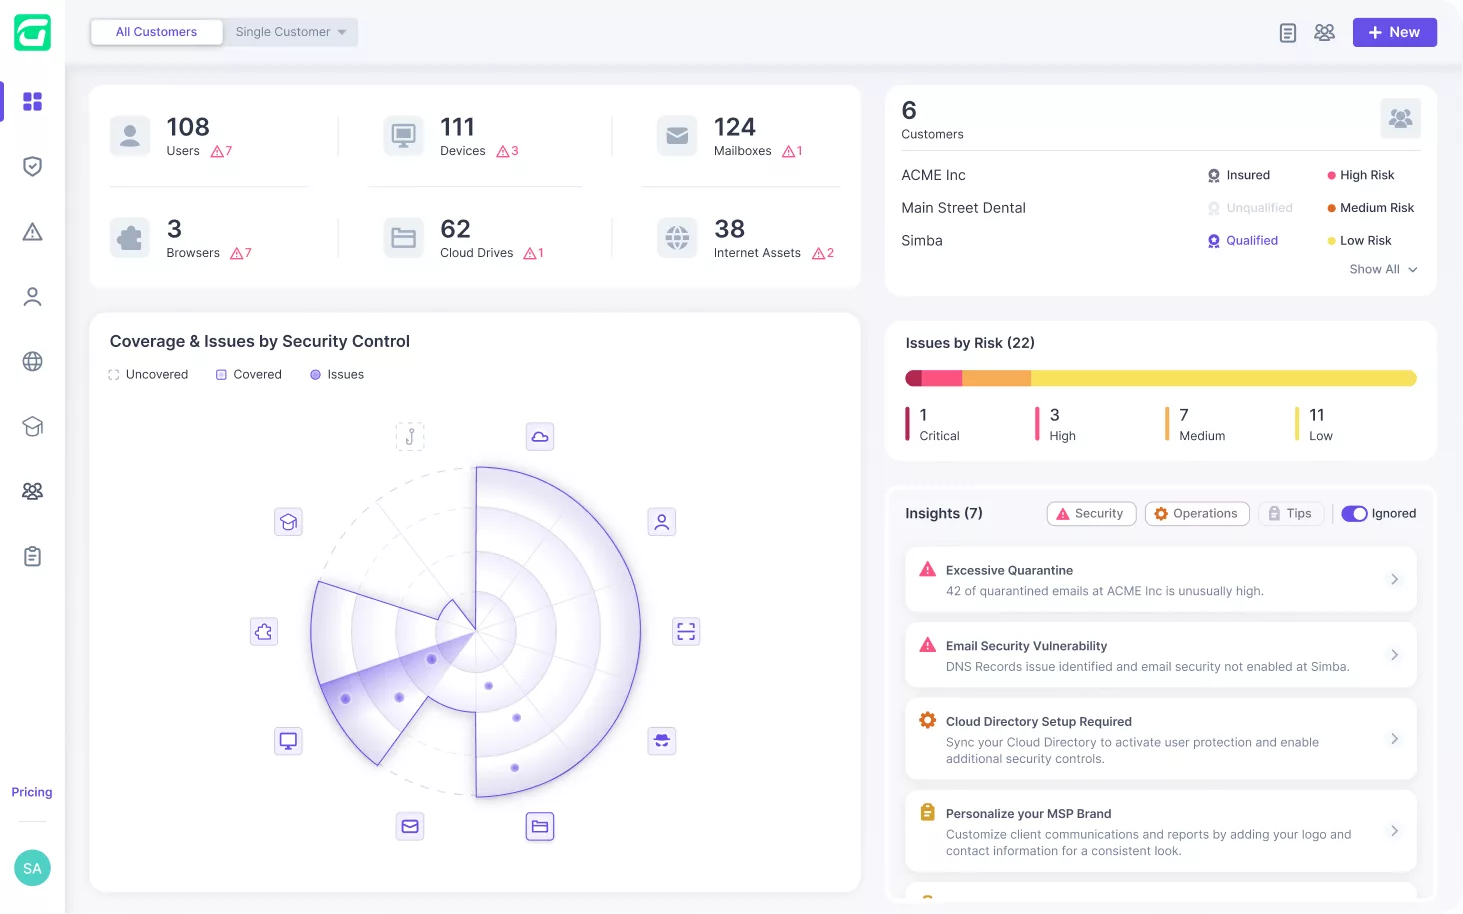
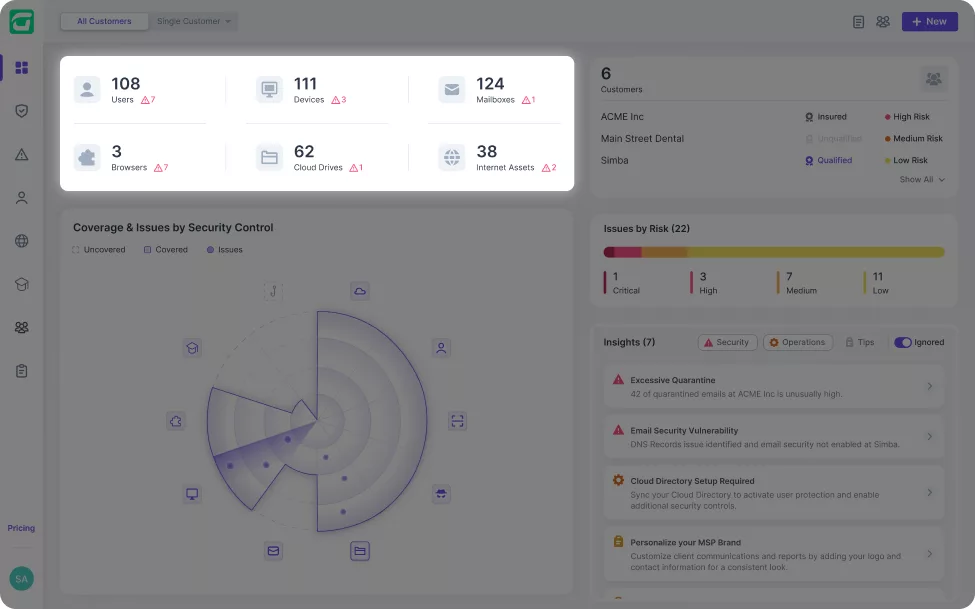
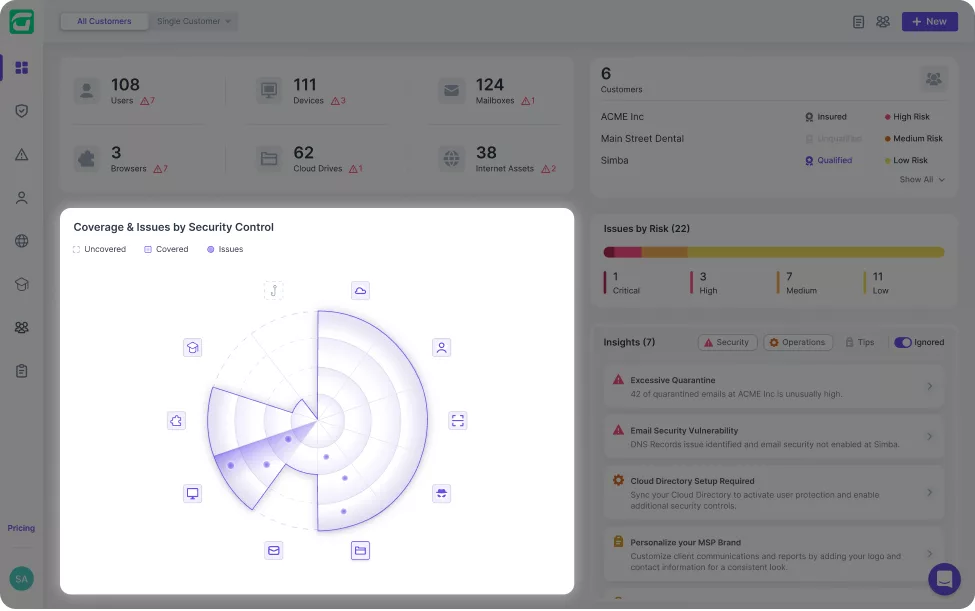
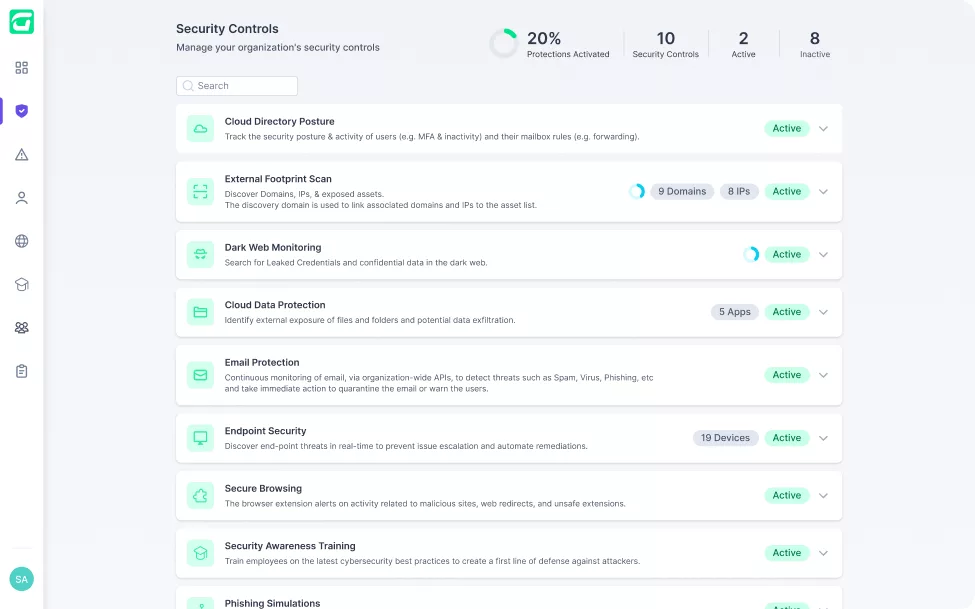
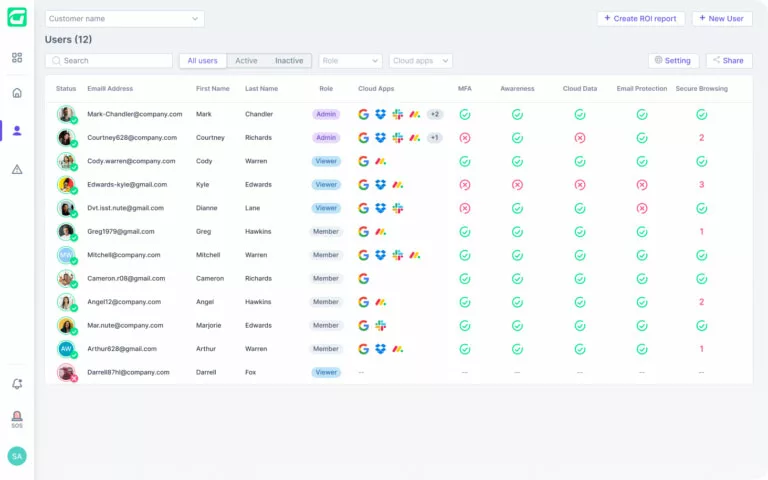
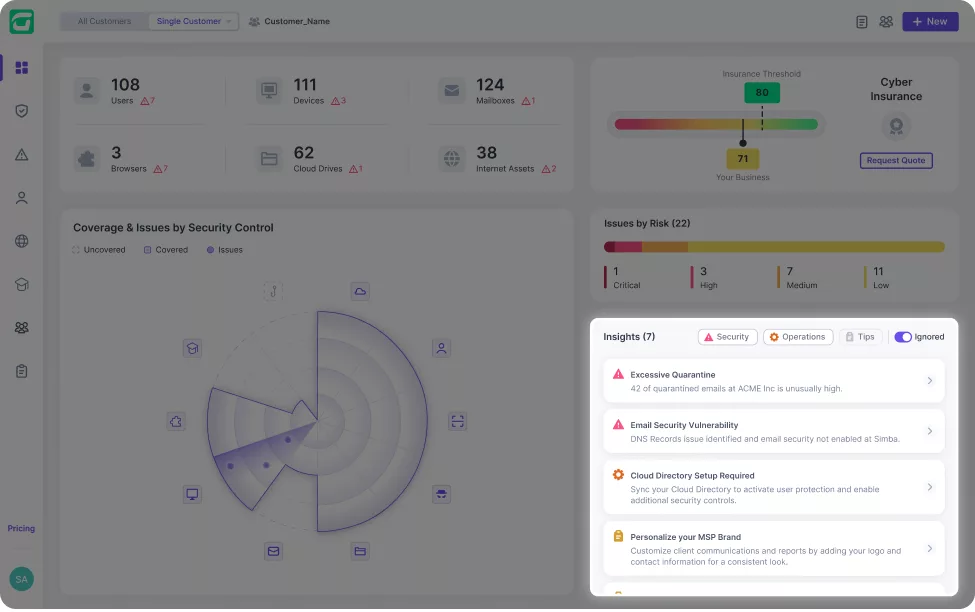
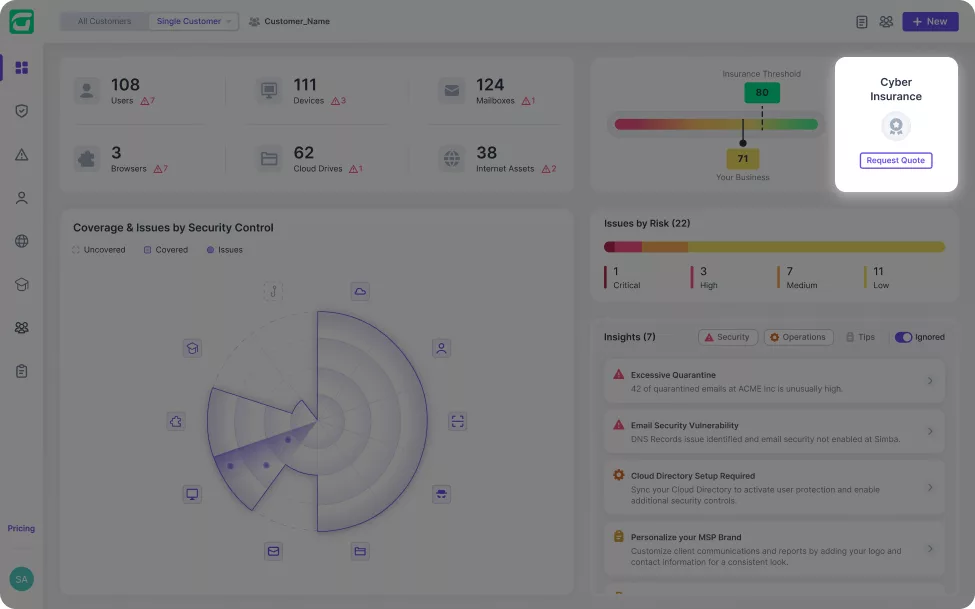
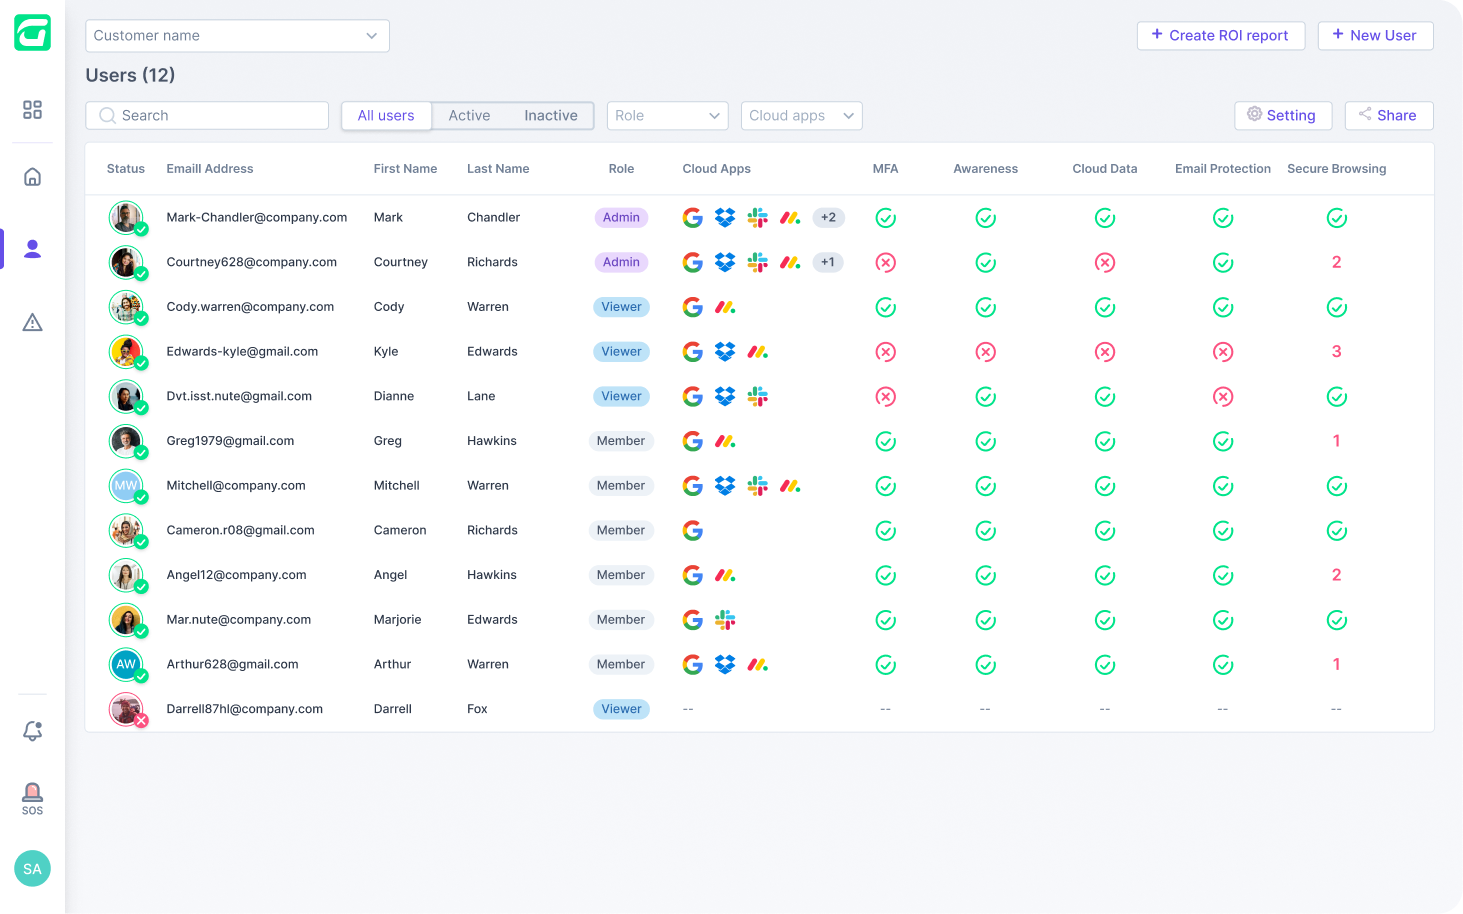
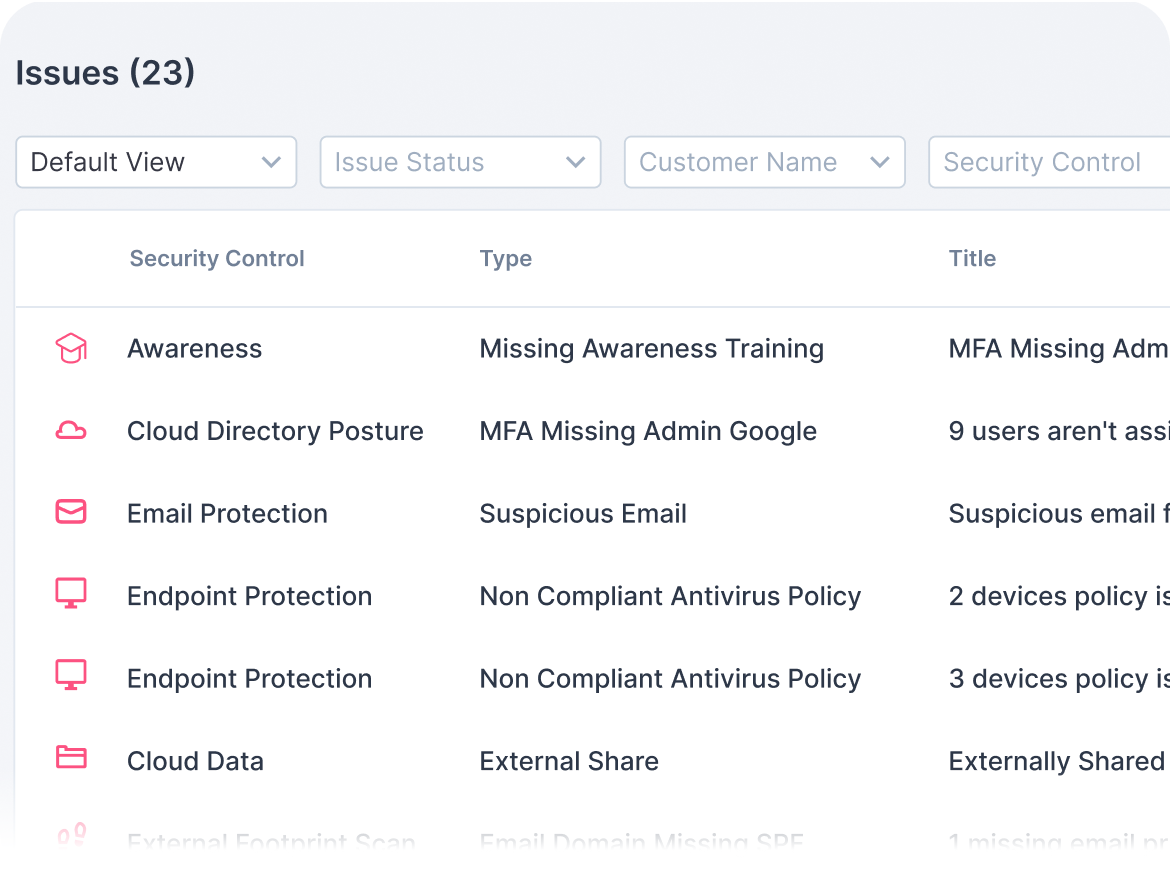
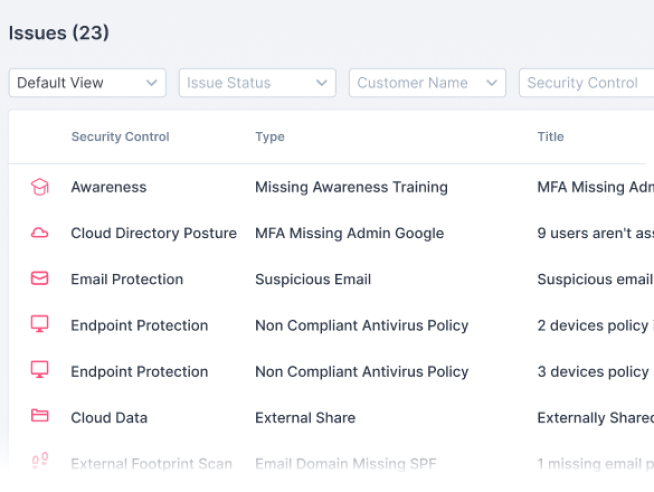
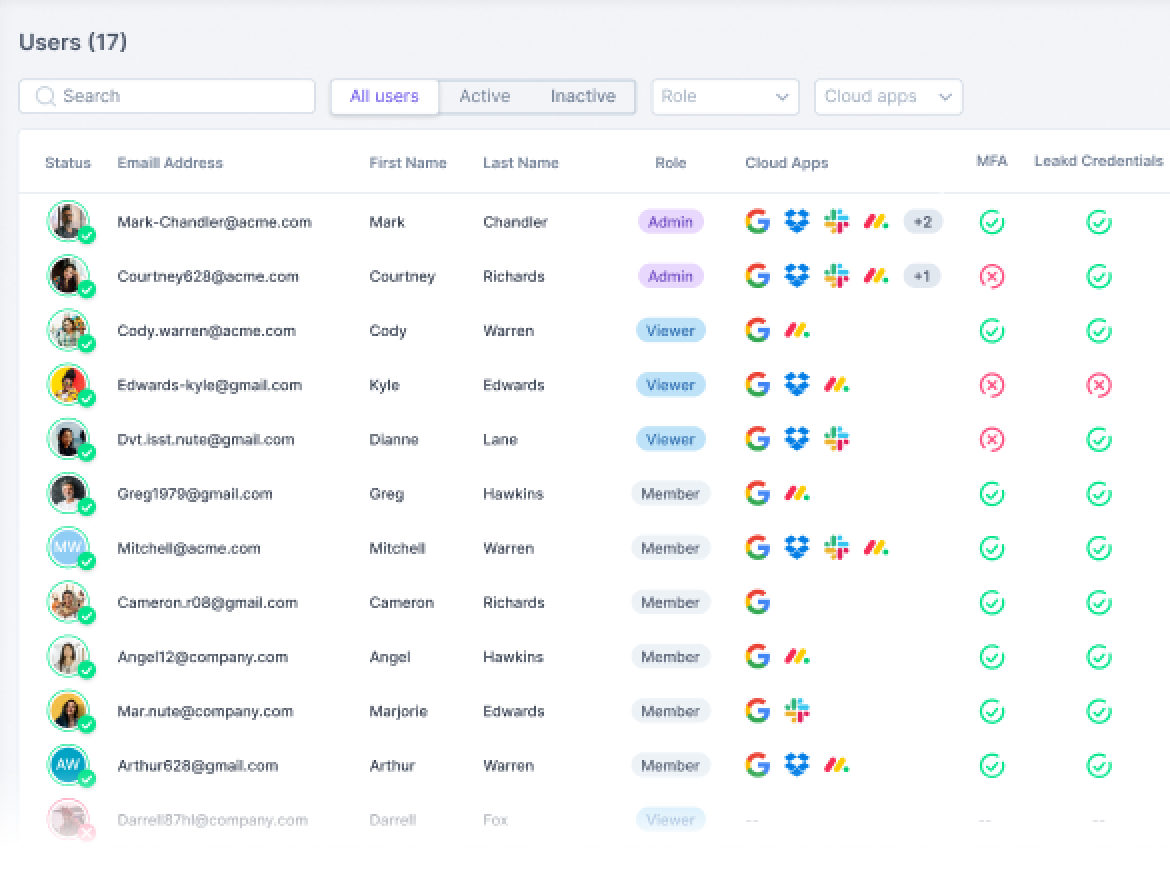
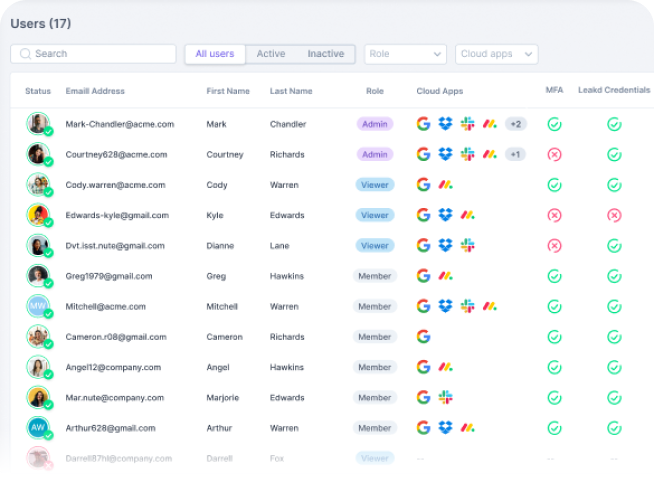
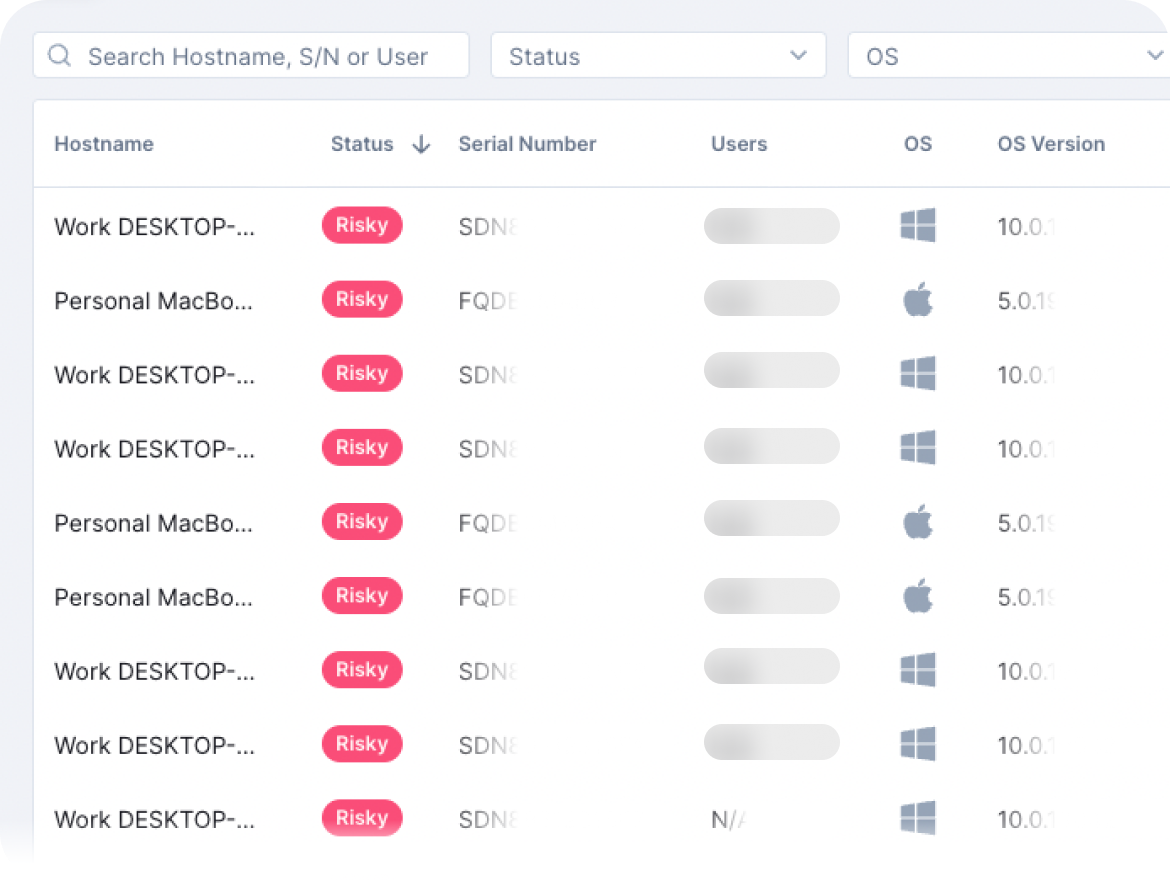
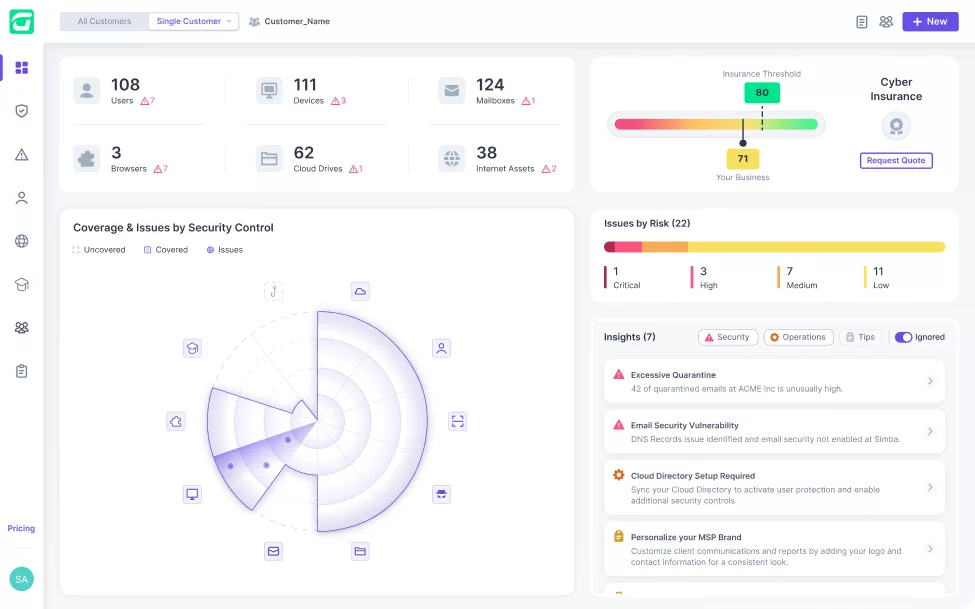
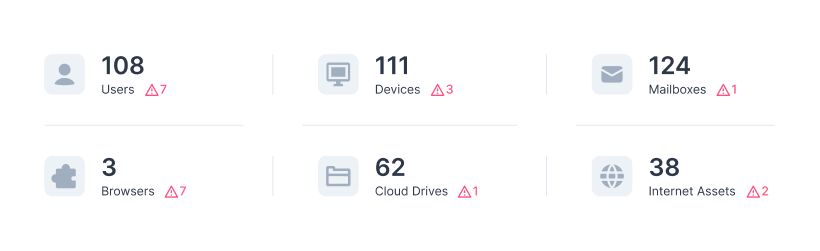
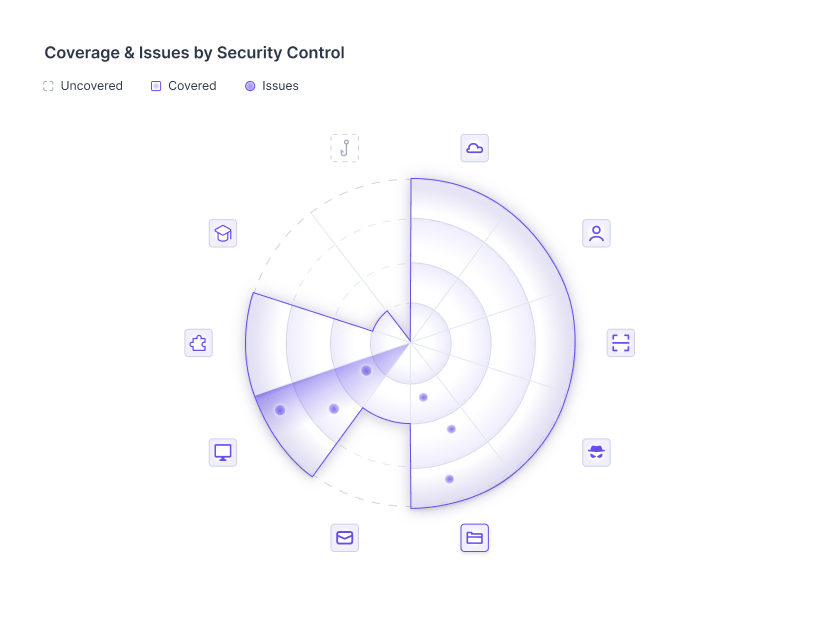
Guardz is designed with a multi-organization perspective that provides an aggregated view and a single-tenant drill-down aspect for individual customers and their employees.


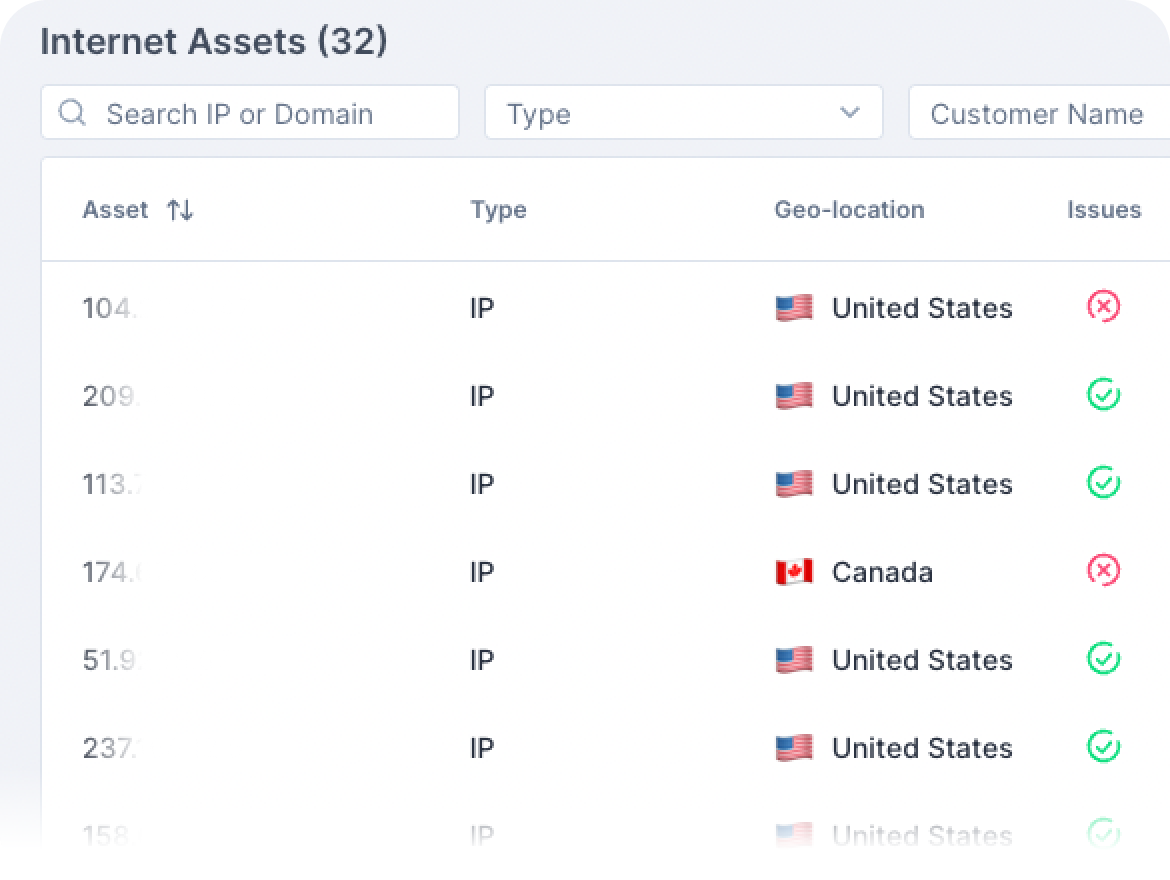
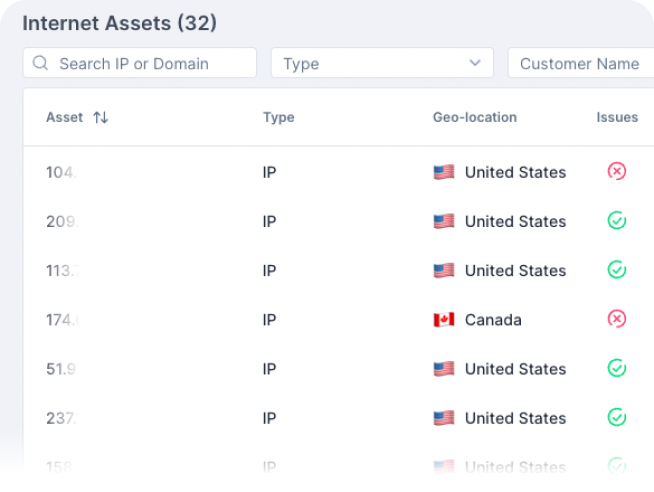
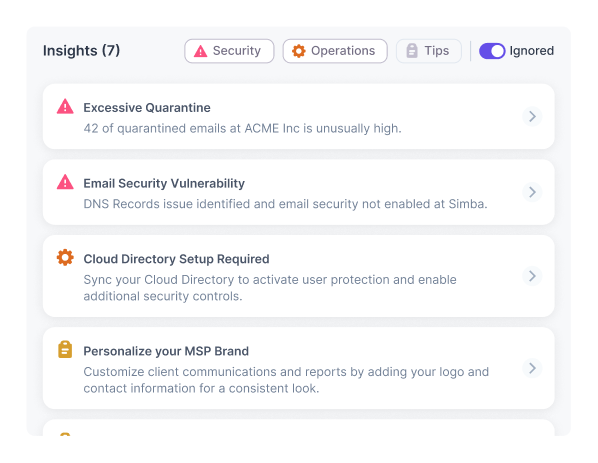
Guardz equips MSPs with a prospecting report, highlighting potential clients’ risks across their digital footprints. This data serves as a powerful tool to attract new clients with pertinent points of interest.


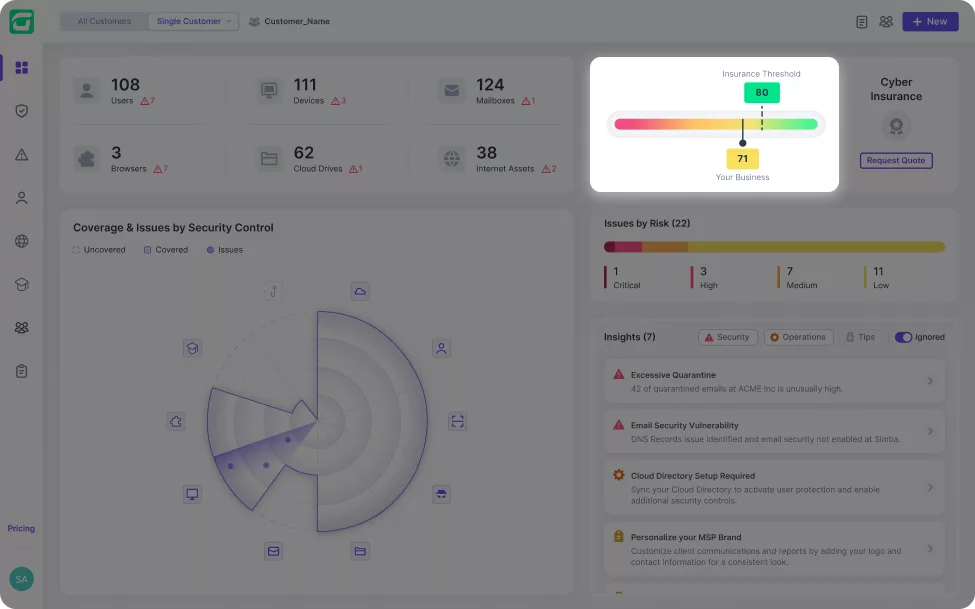
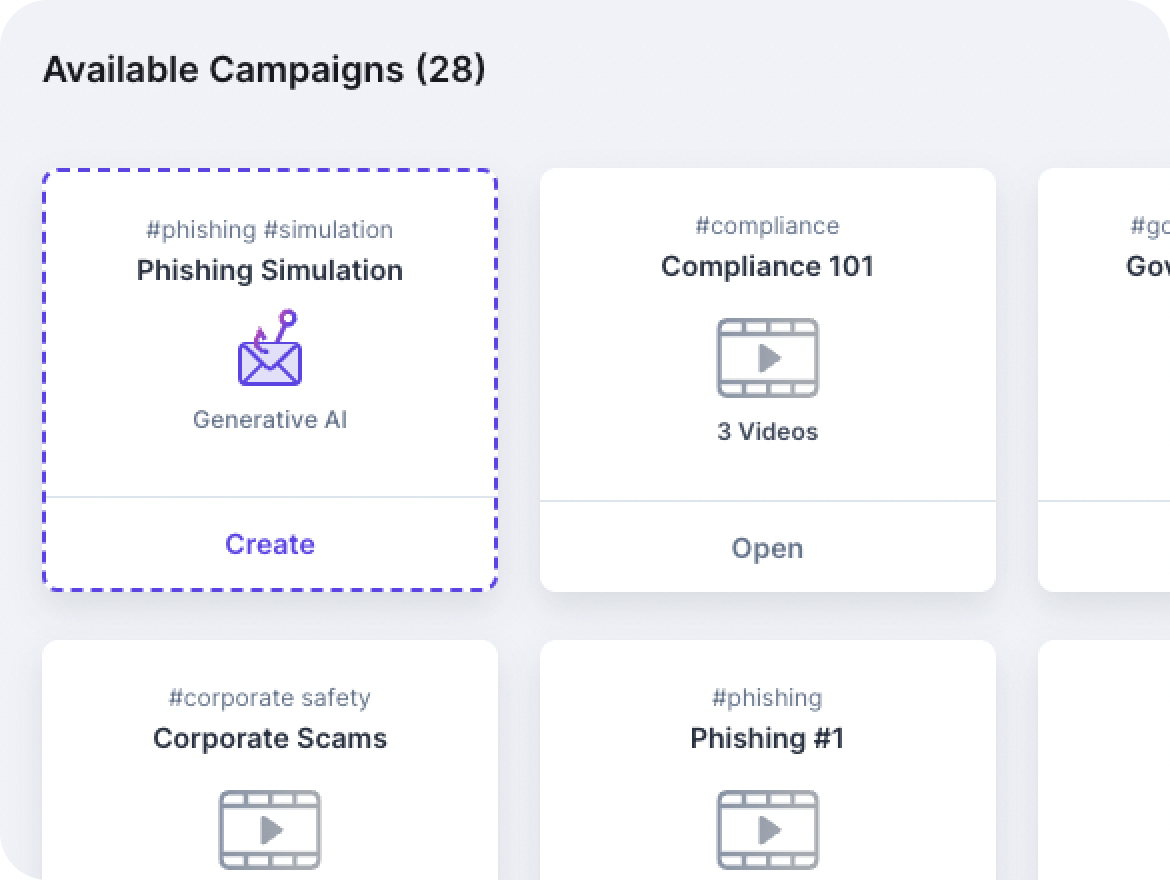
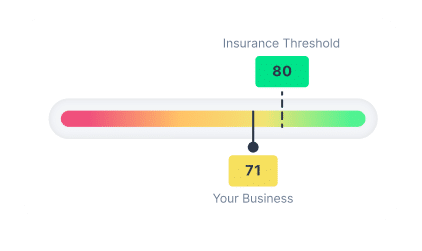
Furthermore, Guardz offers MSPs an ROI report, illustrating the potential financial impact of a cyber attack and employee exposure and compares your clients’ cyber score with the industry benchmark.

Guardz is built specifically for MSPs to holistically secure and insure small and medium sized businesses against evolving threats by leveraging AI and a multilayered approach.


By combining robust cybersecurity technology and deep insurance expertise, Guardz ensures that security measures are consistently monitored, managed, and optimized on a unified platform to prevent the next attack and mitigate the risk.

Holistic Protection.
Hassle-Free.
Cost-Effective.

Screenshot of a dashboard displaying security data. It shows numbers of users, mailboxes, domains, and internet assets. A radar chart visualizes issue coverage, while a bar graph categorizes risk levels. Insights on security concerns are listed on the right.
Screenshot of a security controls dashboard displaying various active controls, including Cloud Directory Posture, External Endpoint Scan, Dark Web Monitoring, Data Protection, Email Protection, Endpoint Security, Secure Browsing, Training, and Simulations.
A user interface showcases a list of 12 users, detailing names, email addresses, roles (admin, editor, viewer), cloud apps in use, and MFA status. With enhanced cybersecurity measures and status icons for awareness and email protection, it’s an essential tool for MSPs aiming to secure & insure data integrity.
Dashboard interface displaying user statistics, device counts, cloud drives, and internet assets. Features a security control radar chart on the left and insights categorized by severity on the right. Vibrant colors indicate risk levels and thresholds.
Illustration of a person in a green jacket standing with arms crossed, casting a superhero shadow on a light background.

Start the Guardz Tour 🕺

All Your Customers' Assets in One Place 👨‍💻

Guardz automatically discovers and monitors all your customers’ digital assets. Drill down to see more details and discover related issues.

Dashboard displaying statistics: 108 Users (7 changes), 111 Devices (3 changes), 124 Mailboxes (1 change), 3 Browsers, 62 Cloud Drives, and 38 Internet Assets, with red delta symbols indicating changes.

You're in the Pilot Seat 🚀

Guardz provides the security controls and coverage across your customers and detects issues in real-time.

A radar chart titled Coverage & Issues by Security Control shows sections with varying shades. Icons around the chart represent different categories, with sections labeled as uncovered, covered, and issues.